Connectivity • Accuracy • Granularity • Adoptability.
A library of analytics, computer vision, and tracking use cases, drawn from real operational problems we have solved across mining and adjacent heavy industries.
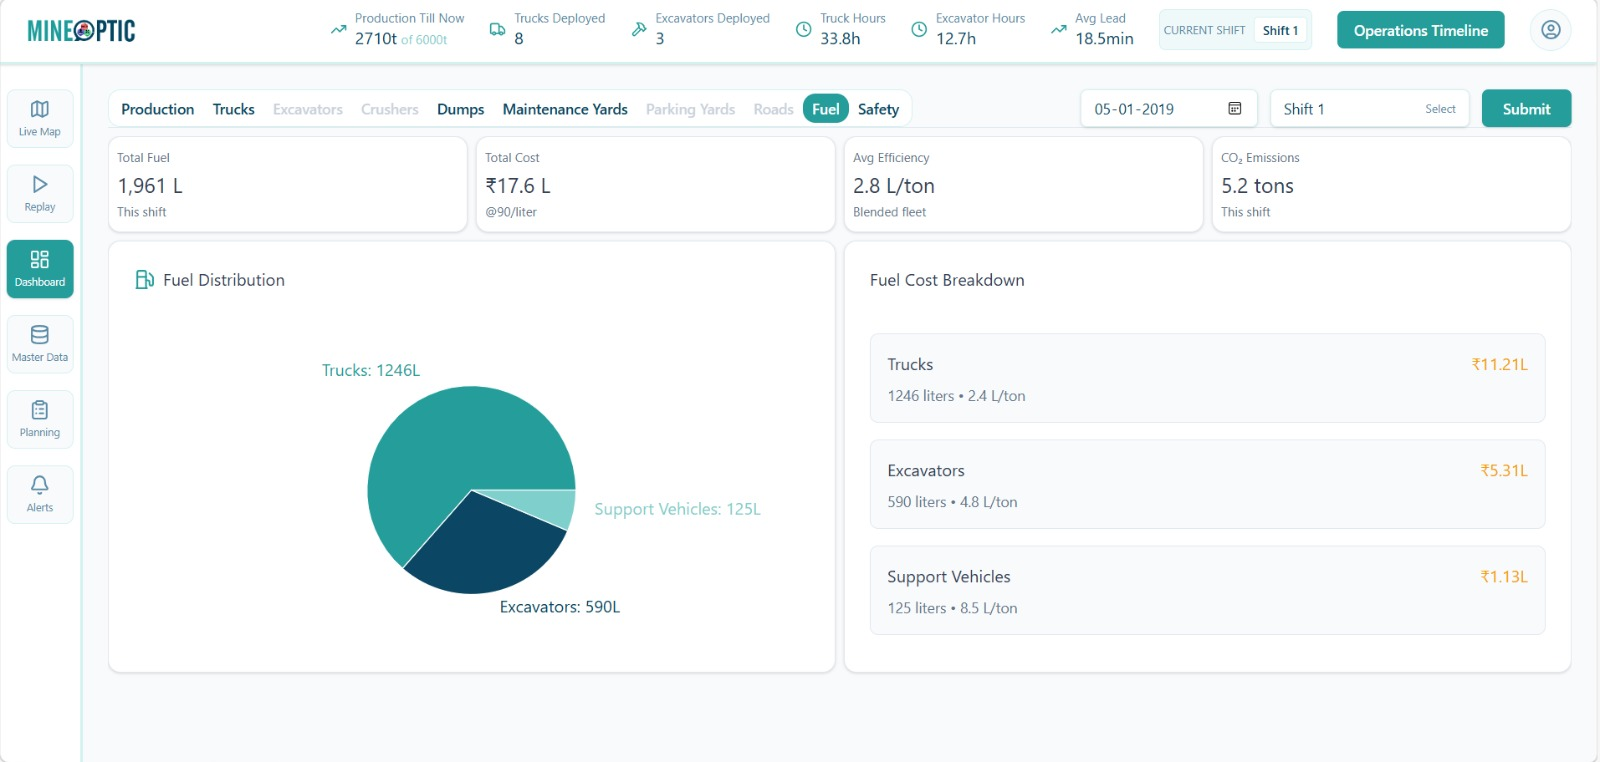
Real-time, automated fuel consumption capture across trucks and machinery, with anomaly detection on every transaction.
Read use case →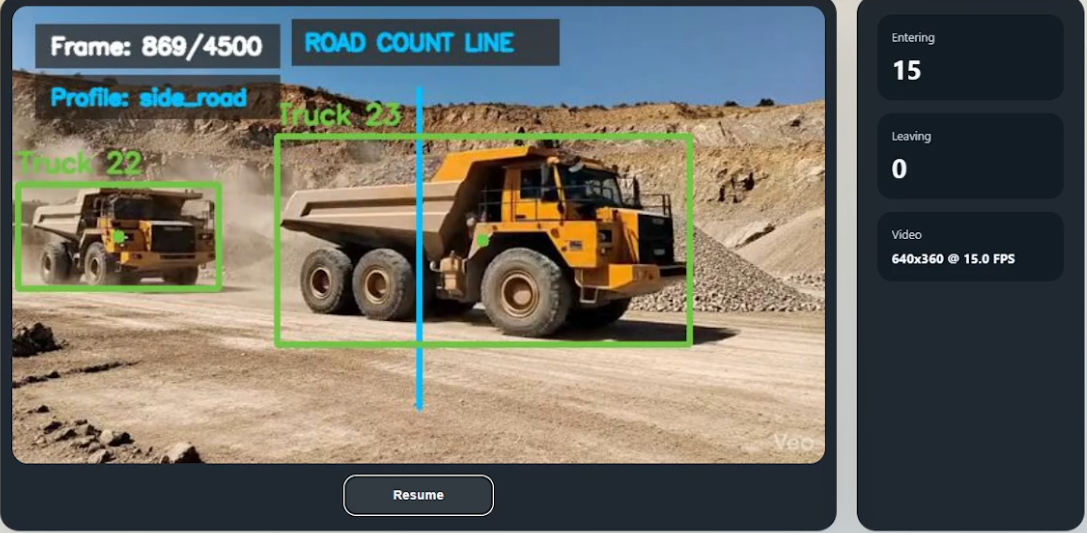
AI-based vehicle detection that automatically counts every truck entering and exiting the dump yard, in real time.
Read use case →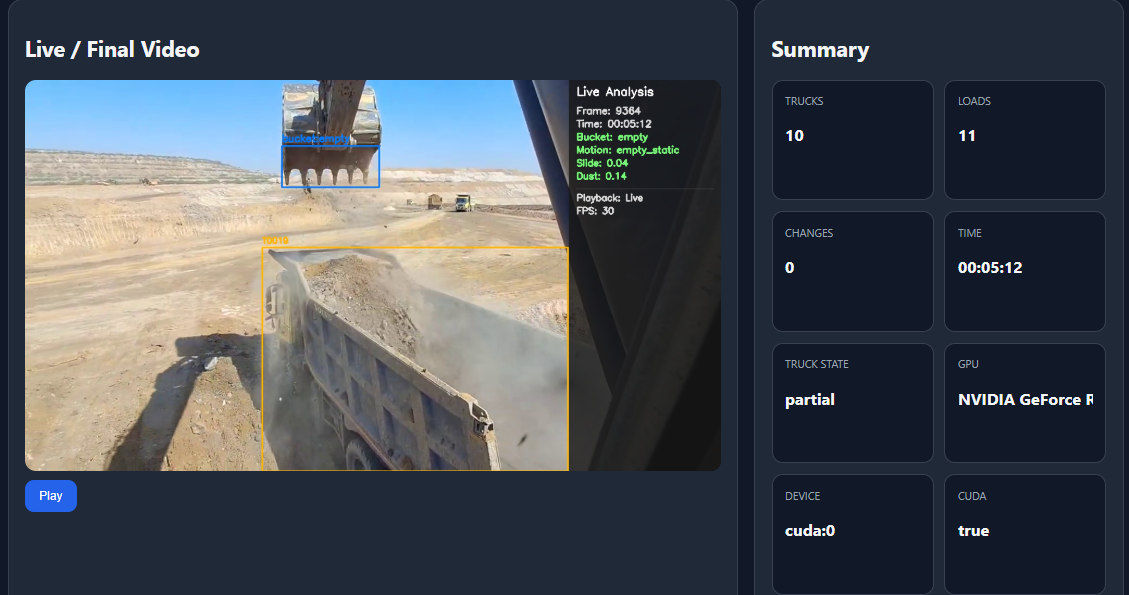
Computer vision that measures excavator bucket loads per truck in real time, exposing true payload and cycle efficiency.
Read use case →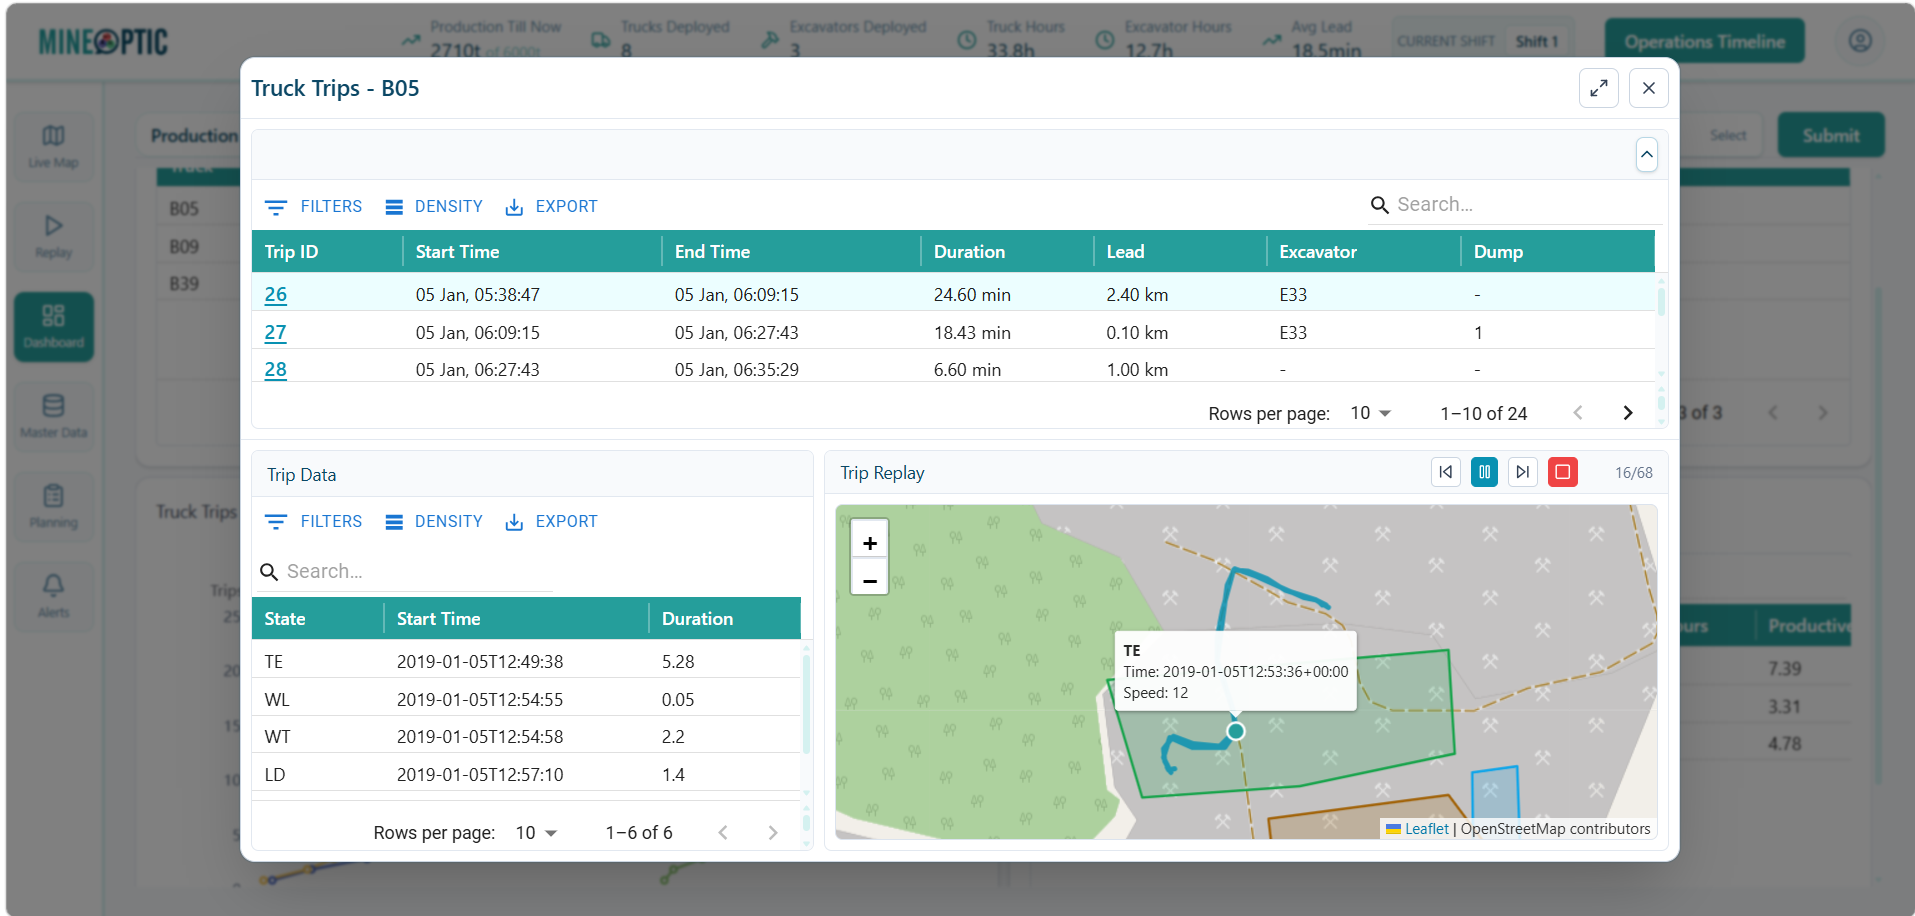
End-to-end truck cycle visibility from loading to dumping, with stage-level timing and bottleneck identification.
Read use case →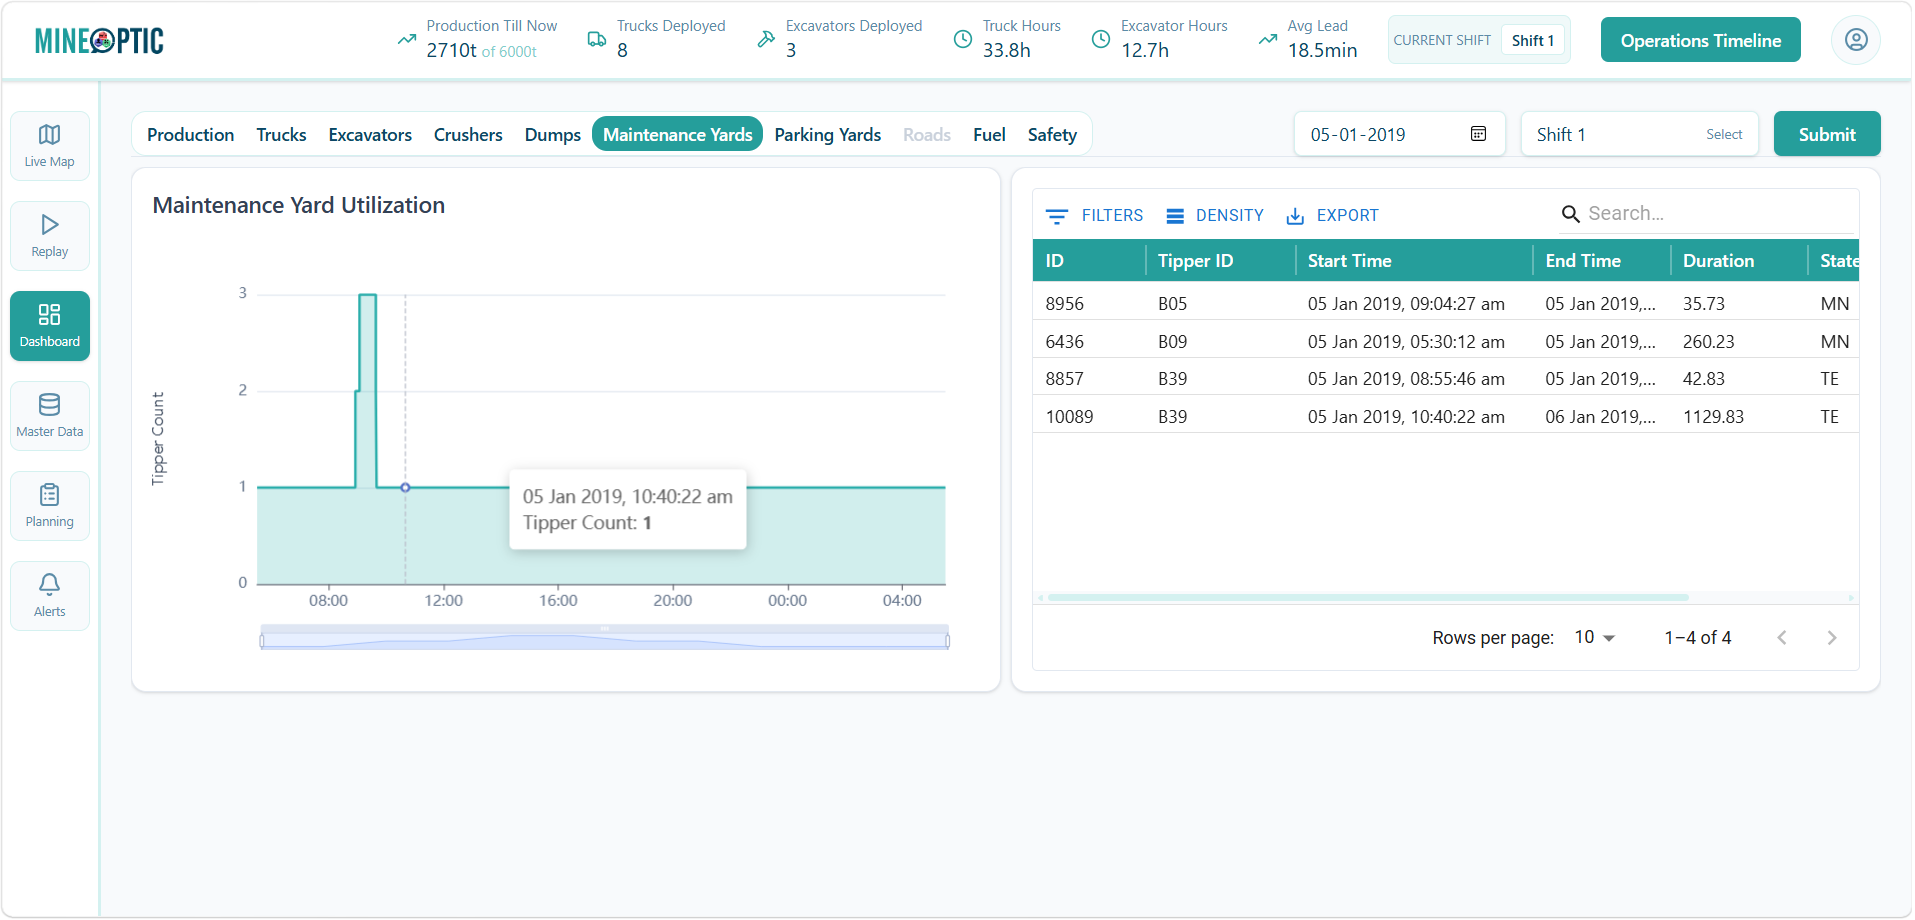
Real-time occupancy of maintenance bays and equipment availability, with turnaround analytics across the workshop.
Read use case →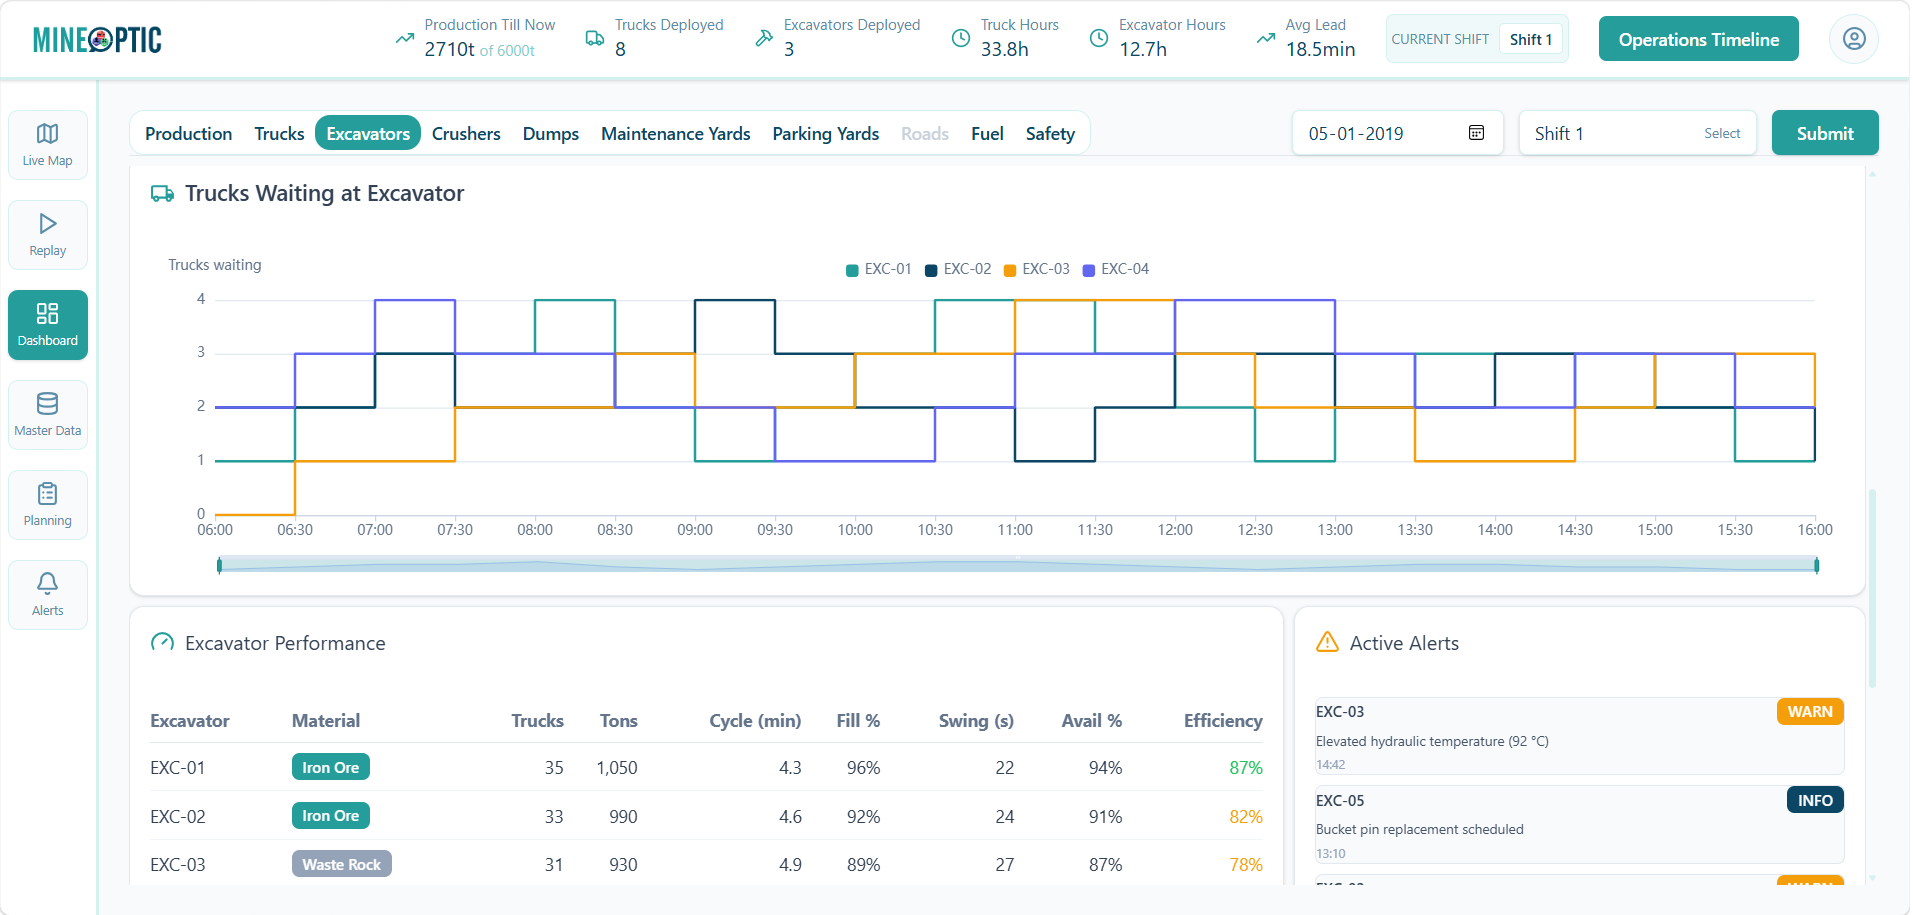
Vision-based queue detection that tracks the line of trucks waiting at each excavator, with live waiting-time analytics.
Read use case →Short, operationally useful pieces on the problems we see in the field, and the thinking behind how we approach them.
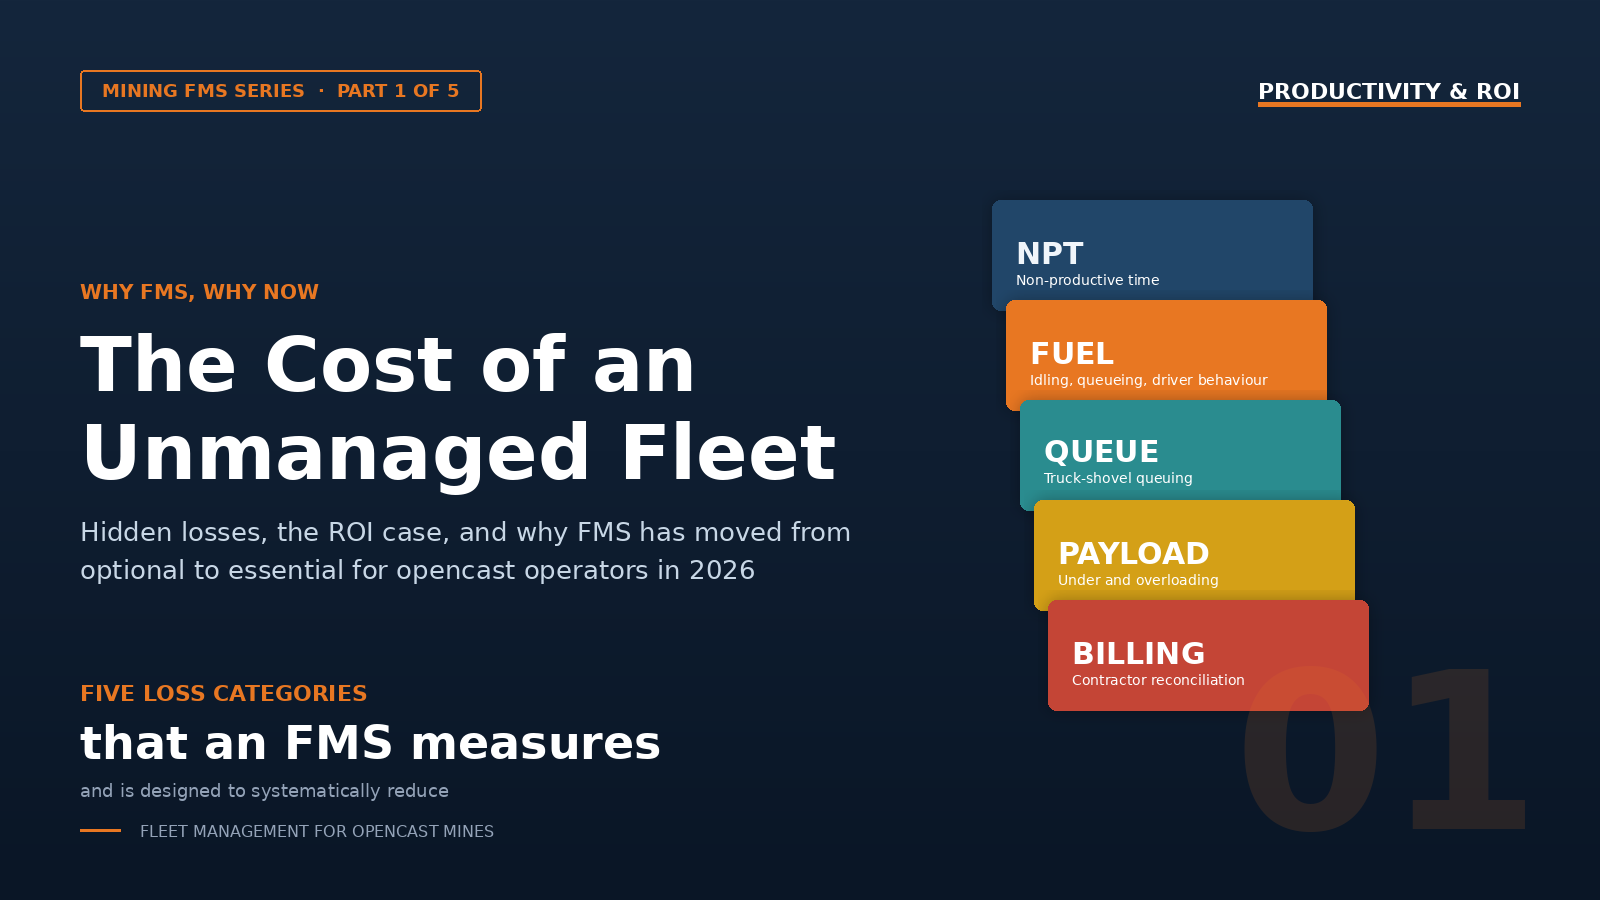
Where the operational losses live, what an FMS actually fixes, and the case for moving on it this financial year.
Read blog →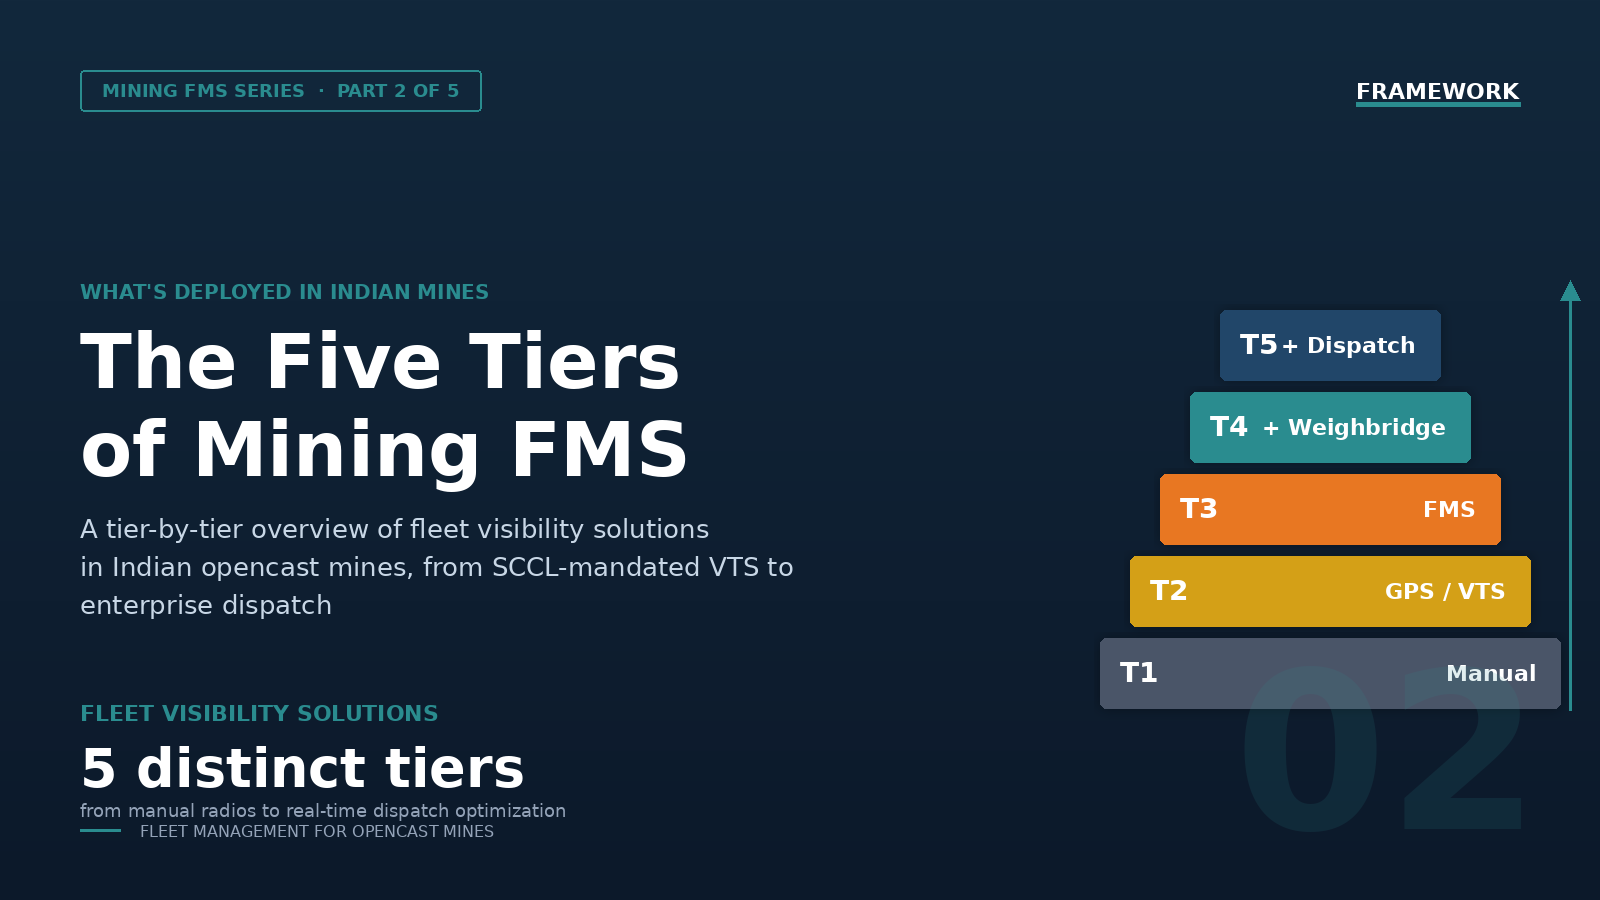
The 5-tier framework actually deployed across Indian opencast mines, from manual controls to full OITDS-style dispatch.
Read blog →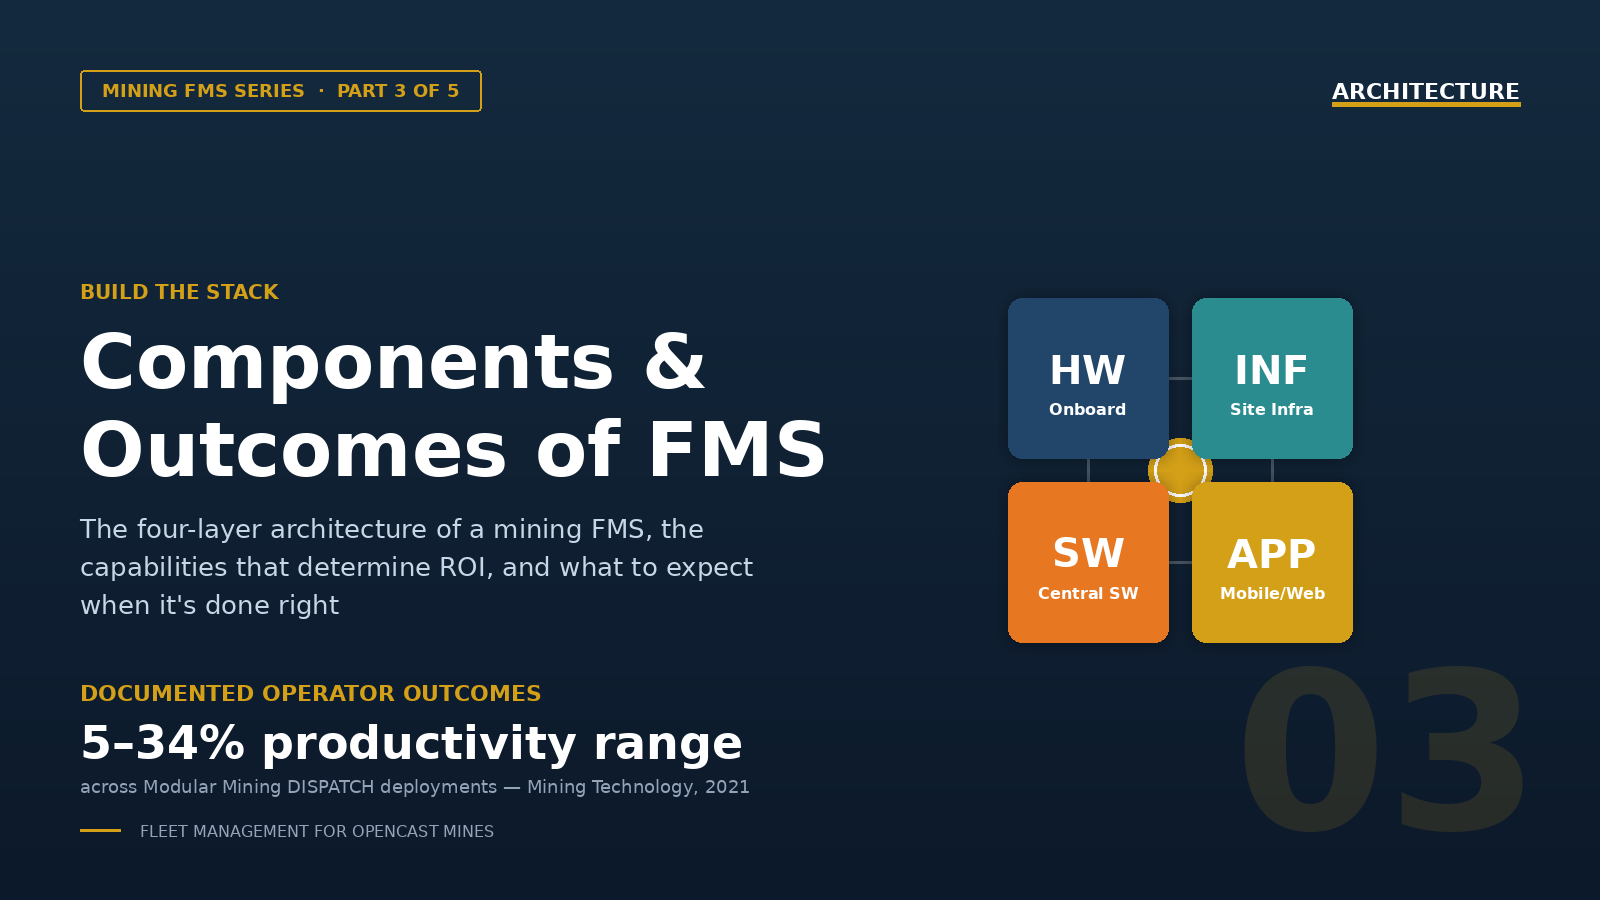
The four-layer architecture, eight capabilities to evaluate, and what real deployments deliver in practice.
Read blog →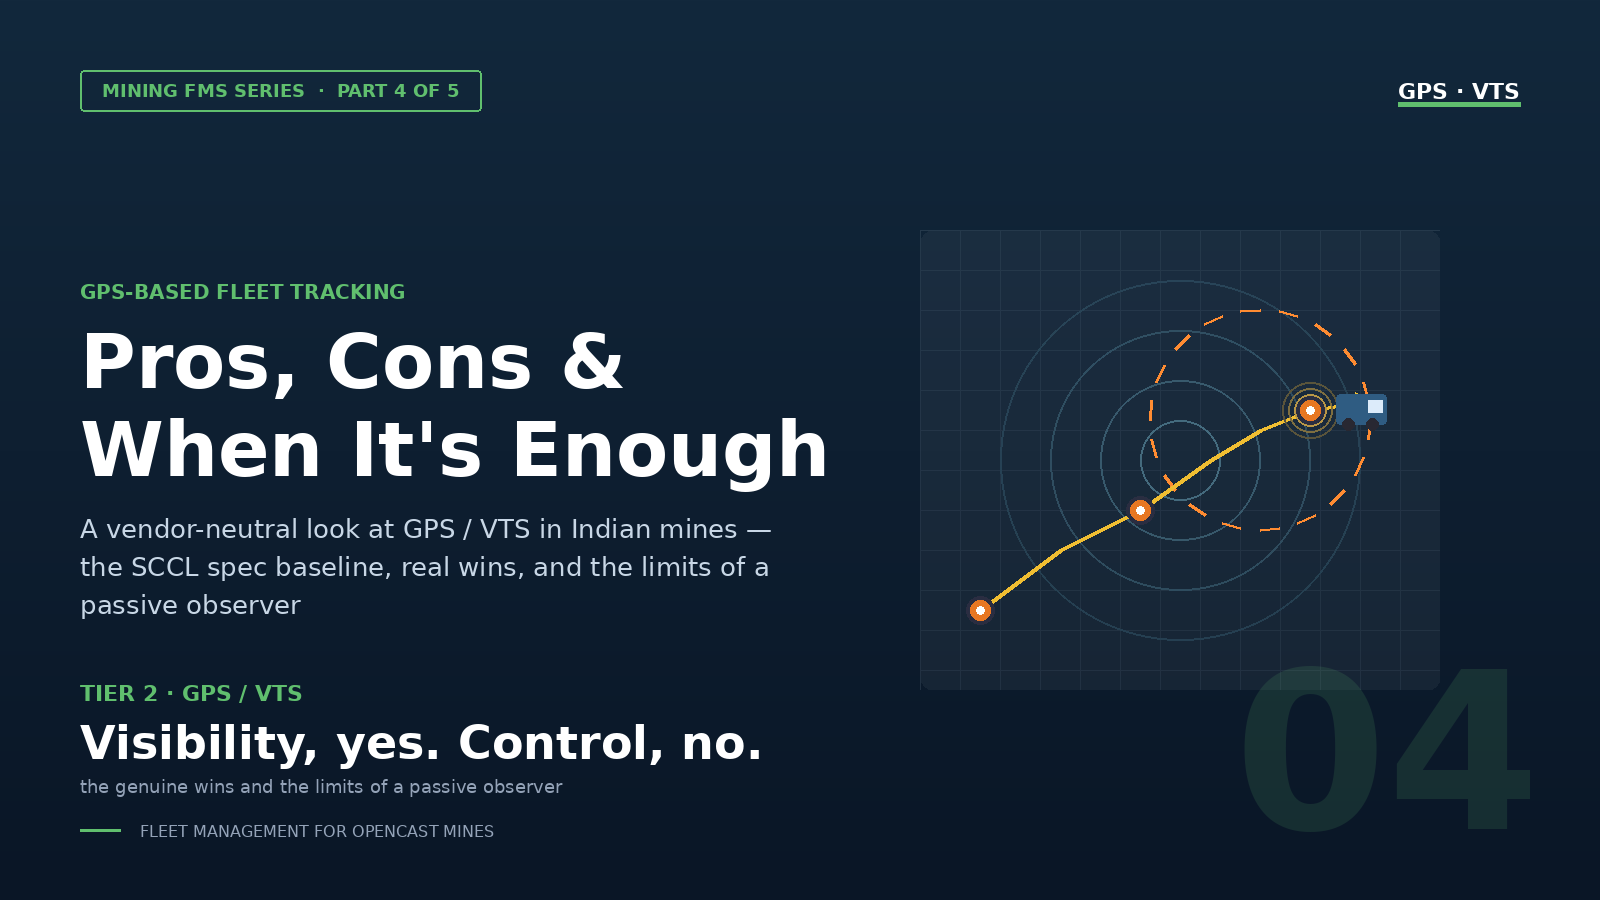
What GPS/VTS does well and where it stops, the SCCL specification baseline, and when GPS alone is the right answer.
Read blog →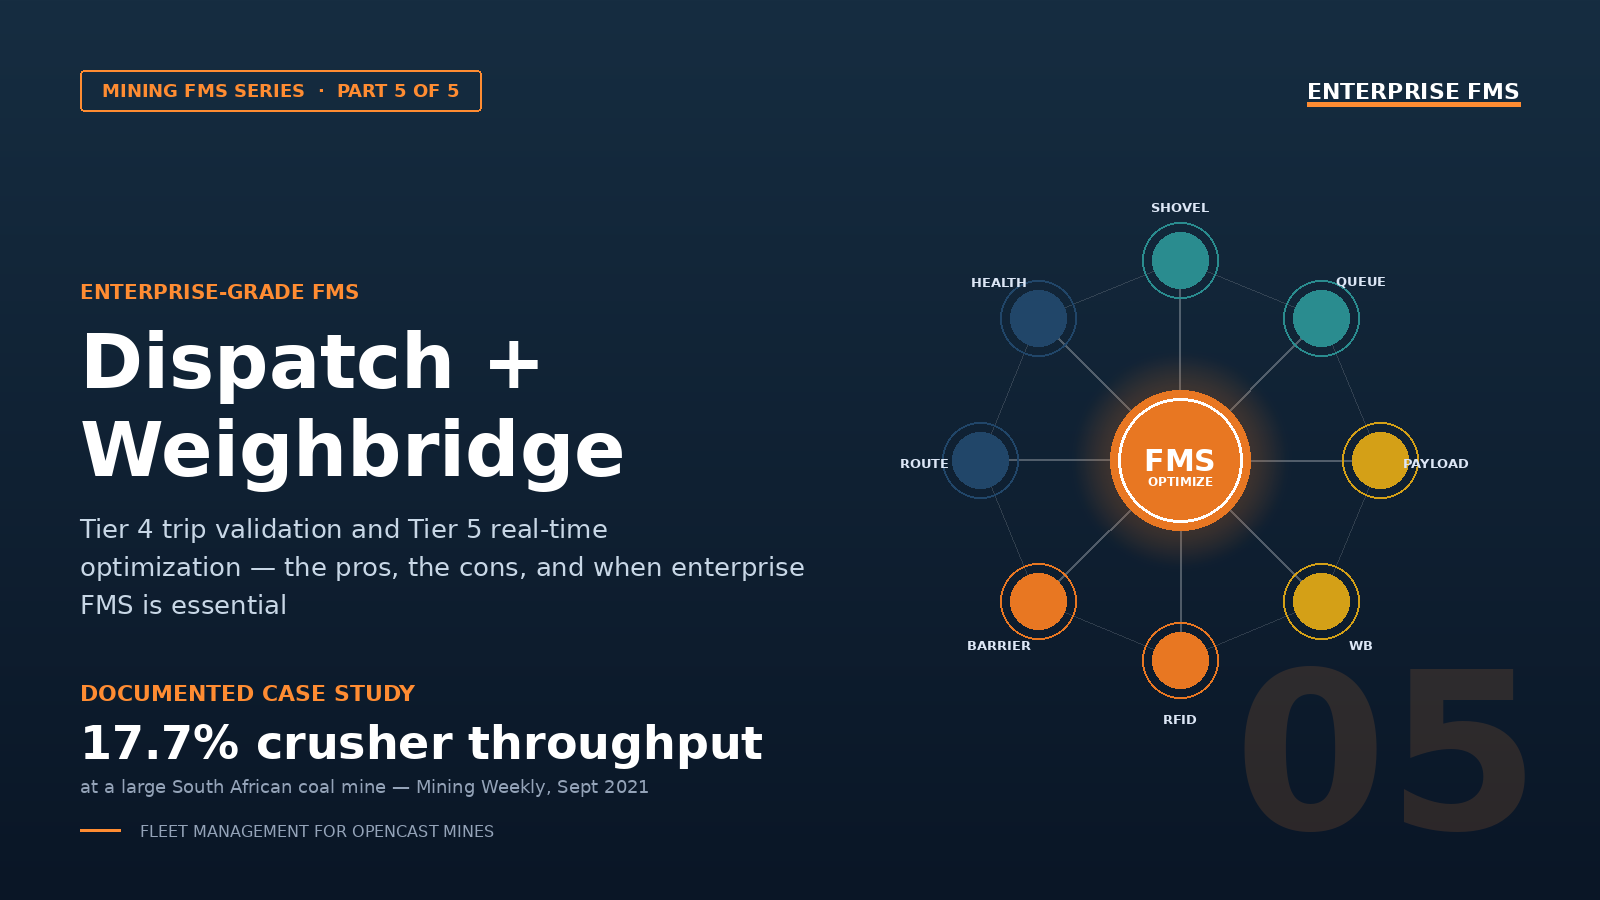
Tier 4 trip validation and Tier 5 real-time dispatch, the pros and cons, and documented outcomes from named deployments.
Read blog →Each case study walks through the before-state, the pillar we addressed, the modules deployed, and the operational outcome.
The mine was logging fuel on paper cards at three bowsers, reconciling manually at shift end, and losing an estimated 4 to 6 cards per week. After rolling out MINEOPTIC Fuel, the site moved to tap-and-snap capture at the bowser, with offline sync to handle the dead zone at the back-of-pit bowser, and eliminated end-of-shift transcription entirely. Fuel reconciliation variance dropped sharply and the fuel-per-tonne number became trusted at the management review.
The planning team had been sizing the tipper fleet per excavator using trip counts and average cycle time. MINEOPTIC Visual started reporting bucket counts per truck, load time per bucket, and queue time at the excavator. Within a shift, the manager could see which excavators were starving their fleet and which had excess tippers. The fleet was rebalanced within a week.
A standard GPS tracker deployment had been live for two years but never used by the operations manager, the public GSM coverage dropped in the deepest bench, so the pit floor was effectively invisible. MINEOPTIC Plus was deployed on the mine’s own connectivity fabric. The pit floor came online, time-sync across moving and stationary assets held up, and the manager began using the fleet-status view as the primary operational screen.
Production data lived in dispatch software, fuel data in Excel, and weighbridge data in a separate SQL database, each reconciled weekly. MINEOPTIC Canvas was connected to all three sources with the data layer on the mine’s own server. The operations team built a single shift dashboard that reconciled the three sources automatically. The weekly reconciliation meeting was retired.