Mineoptic Canvas

Your mine’s digital twin, on your database.

A self-service BI tool built specifically for mines.

Compose the digital twin of the operation — pits, routes, faces, fleets, plants — and wire it to whatever data you already have. Stored on your mine’s own database, so the data never has to leave your control.

Mineoptic Canvas dashboard

What makes Canvas different from a generic BI tool

Mining-first vocabulary.

Faces, benches, haul roads, crushers, tips — not just rows and columns.

Digital twin composition.

Drop in assets, routes, and zones to build an operations view that mirrors the mine.

Multi-source data.

Excel, CSV, SQL, data servers, ERP — connect it and reconcile it in one place.

Data sovereignty by design.

Point Canvas at your own database. Nothing sensitive has to travel to a vendor cloud.

Self-service for operations.

Planners, supervisors, and managers can build their own views — no long IT backlog.

Object-linked dashboards.

Details about assets, locations, functions and the mine intuitively linked, so managers draw inferences from a single page.

The problems Mineoptic Canvas is built to solve

  • Data scattered across Excel workbooks, dispatch software, fuel logs, and the weighbridge, with no common view.
  • A generic BI tool that does not speak mining, so every dashboard is built from scratch.
  • Production data leaving the site for a vendor cloud, which compliance and security teams will not sign off on.
  • End-of-shift decisions because there is no live aggregation layer that reconciles across sources.
  • IT backlogs that mean every new report waits weeks to be built.
  • Searching for the right dashboard for the right metric, often losing the perspective in the process.

What you can build on Canvas

Production dashboards

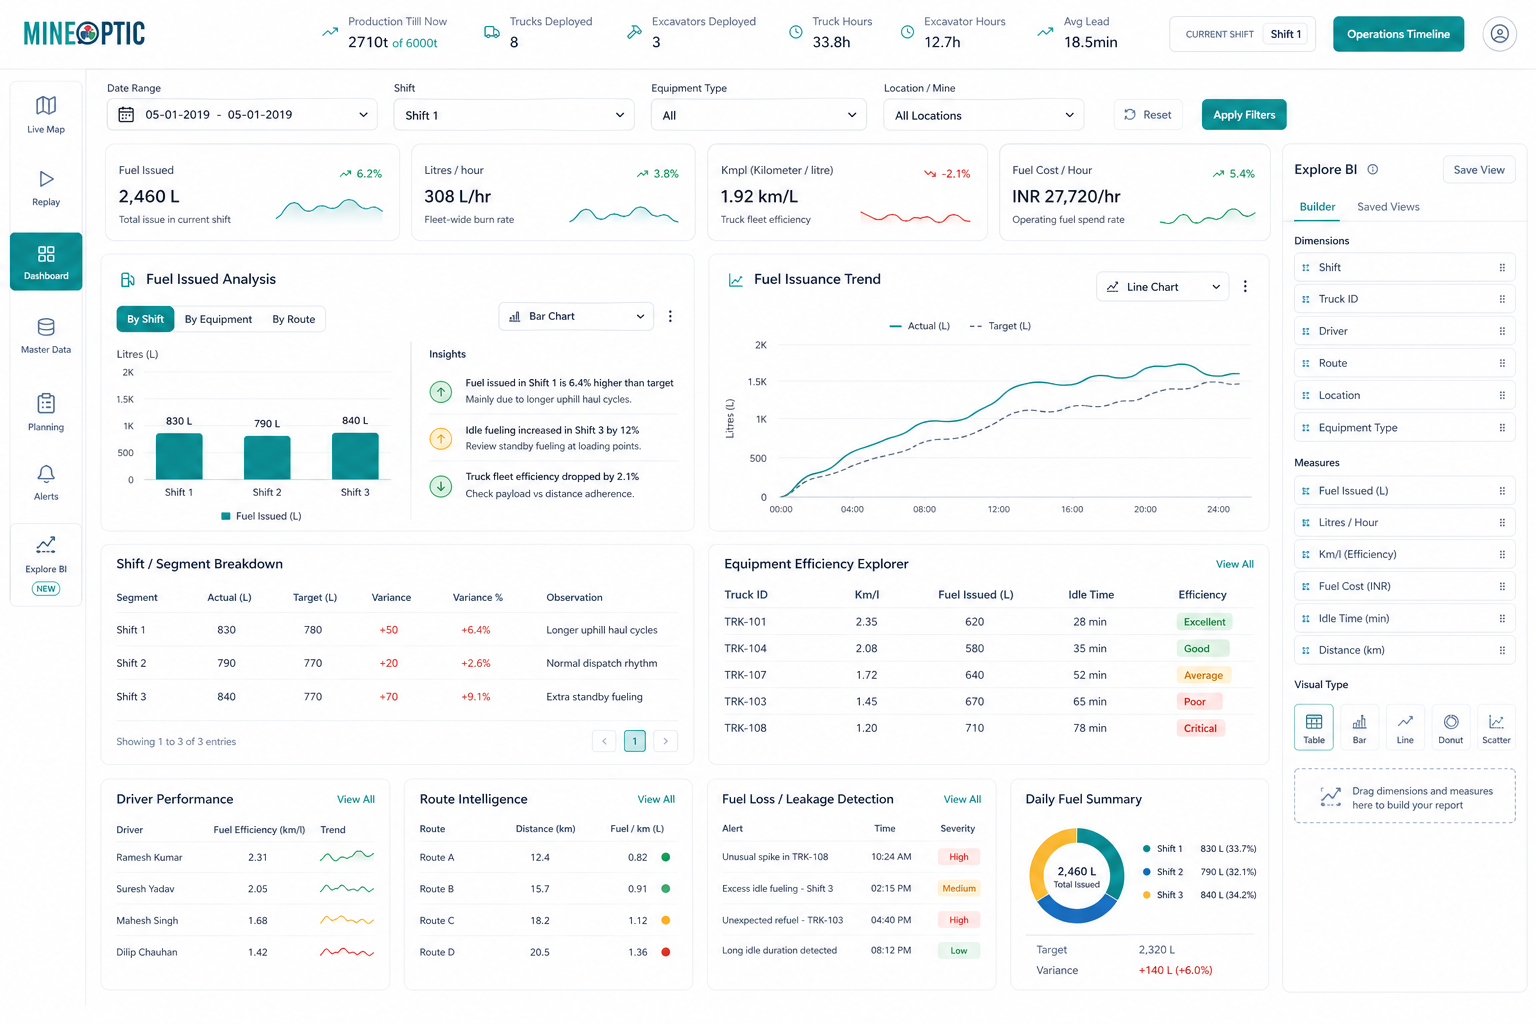
Tonnes per shift, per face, per crew, reconciled across dispatch, weighbridge, and visual counts.

Fleet utilisation views

Truck states, cycle times, queue times, rolled up to fleet, route, or excavator level.

Fuel and cost dashboards

Fuel per tonne, per truck, per route, reconciled against the Mineoptic Fuel ledger.

Bottleneck maps

Queue times overlaid on the mine layout, so the problem is obvious at a glance.

Planning vs actual

Plan adherence by shift, by face, by route — in a single view.

Mine View

Where everything happens, not in report pages. Managers can jump to a point of interest without checking various reports.

Data sovereignty, made explicit

Sensitive production and commercial data should not be a vendor’s problem. Mineoptic Canvas is built so the data layer sits on your mine’s infrastructure. You control the database; we provide the engine and the interface. When an audit or a compliance review asks where the data lives, the answer is simple: it never left.

Who Mineoptic Canvas is for

  • Operations and planning teams that want to build their own views without waiting on IT.
  • Mines that need a real digital twin but are not going down the enterprise FMS path.
  • Companies that want to integrate other IT systems for analysis such as financial impact, mine planning, and operations simulation.
  • Groups with strict data-residency requirements where production data must stay on-site.
  • Teams already using Mineoptic Lite or Plus who want one canvas to see everything together.

Compose your digital twin.

See Mineoptic Canvas wired to your real data.