Operations Intelligence use case
Truck Cycle Time Analysis
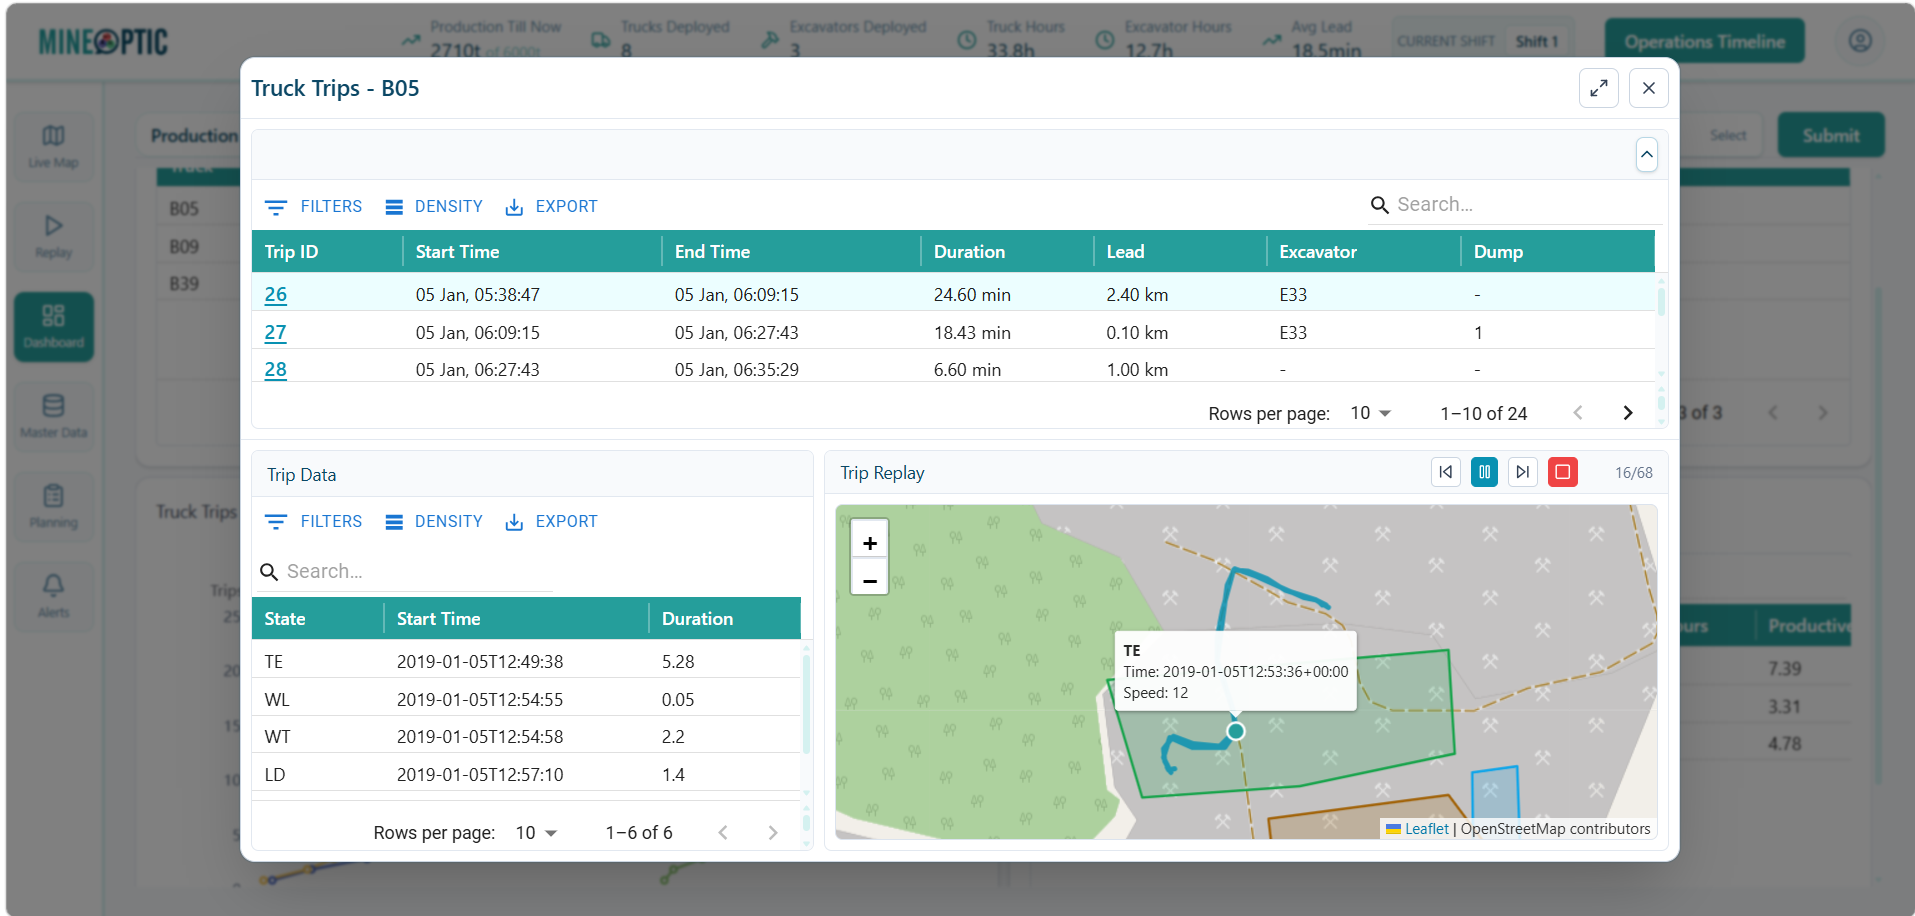
End-to-end truck cycle visibility from loading to dumping, with stage-level timing and bottleneck identification.
The problem
What this use case is built to solve
Gross cycle time is the only metric most mines track. It hides where the time is actually going.
How it works
The mechanism
MINEOPTIC stitches fleet status (Plus) with visual counts (Visual) and weighbridge events into a single per-trip timeline. Every cycle is broken down into load, haul, queue, dump, and return, with the slow stage flagged automatically.
Module: MINEOPTIC Plus + Visual
What it captures
The data points
- Load, haul, queue, dump, return time per cycle
- Bottleneck stage flag per cycle
- Per-excavator and per-route distributions
- Per-operator cycle quality
Outcomes
What changes for the operation
- Cycle accountability per crew and per route
- Bottleneck-first dispatch decisions
- End of the gross-cycle blind spot
- Haul road improvement decisions backed by data
See this running on a real shift.
Book a demo and we will show you Truck Cycle Time Analysis on a live mine.